≪p><b><b><span Style="font-Size:20pt;"><span Style="color:#FF0000;"> ≪/span></span> ≪/b> the Graph Shown Displays
<p><b><b><span style="font-size:20pt;"><span style="color:#FF0000;"> 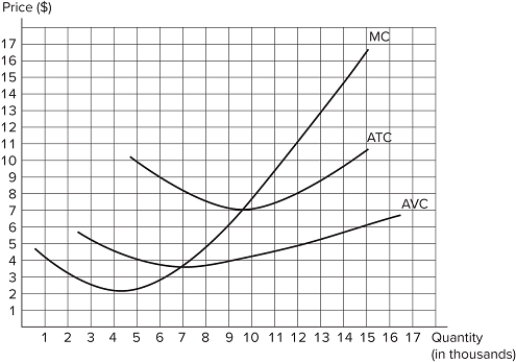 </span></span> </b> The graph shown displays the cost curves for one firm in a perfectly competitive market. If the market price is $6, this firm should:
A) shut down in the short run and exit in the long run.
B) continue producing in both the short run and the long run.
C) increase the price to $7 in the short run.
D) continue producing in the short run but exit in the long run.
Correct Answer:
Verified
Q94: In the short run, the fixed costs
Q95: If a firm in a perfectly competitive
Q96: Of the curves displayed in the graph
Q97: In the short run, the fixed costs
Q98: If the market price falls below the
Q100: The market price has fallen below a
Q101: The graph shown displays the cost curves
Q102: In the short run, we assume that
Q103: The number of firms in a perfectly
Q104: If a firm in a perfectly competitive
Unlock this Answer For Free Now!
View this answer and more for free by performing one of the following actions

Scan the QR code to install the App and get 2 free unlocks

Unlock quizzes for free by uploading documents