The graph shown represents the cost and revenue curves of a firm in a perfectly competitive market. 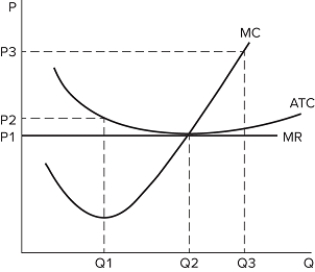 If the firm is producing at Q2, and it is identical to other firms in the market:
A) profits are not being maximized.
B) firms will enter this market.
C) economic profits are zero.
D) firms will exit this market.
Correct Answer:
Verified
Q154: The graph shown represents the cost and
Q155: If demand increases in a perfectly competitive
Q156: The graph shown represents the cost and
Q157: In a perfectly competitive market, when the
Q158: If demand increases in a perfectly competitive
Q160: The graph shown represents the cost and
Q161: When demand increases in a perfectly competitive
Q162: When demand increases in a perfectly competitive
Q163: In a perfectly competitive market in which
Q164: If demand in a perfectly competitive market
Unlock this Answer For Free Now!
View this answer and more for free by performing one of the following actions

Scan the QR code to install the App and get 2 free unlocks

Unlock quizzes for free by uploading documents