Use the following to answer questions:
Figure: The Demand Curve for Oil 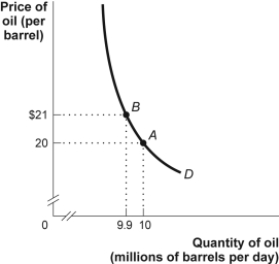
-(Figure: The Demand Curve for Oil) Look at the figure The Demand Curve for Oil. Demand is price _____ between $20 and $21, since total revenue _____ when the price _____.
A) elastic; increases; decreases
B) inelastic; stays the same; decreases
C) elastic; decreases; increases
D) inelastic; increases; increases
Correct Answer:
Verified
Q213: Use the following to answer questions:
Figure: The
Q214: Use the following to answer questions:
Figure: The
Q215: It is very difficult for Julia to
Q216: Use the following to answer questions:
Figure: The
Q217: The long-run price elasticity of supply of
Q219: Use the following to answer questions:
Figure: The
Q220: Which of the following is likely to
Q221: Use the following to answer questions:
Figure: The
Q222: Consider the market for strawberries. Which of
Q223: Use the following to answer questions:
Figure: The
Unlock this Answer For Free Now!
View this answer and more for free by performing one of the following actions

Scan the QR code to install the App and get 2 free unlocks

Unlock quizzes for free by uploading documents