Use the following to answer questions:
Figure: Harold's Indifference Curves
The figure shows three of Harold's indifference curves for bread and cheese. 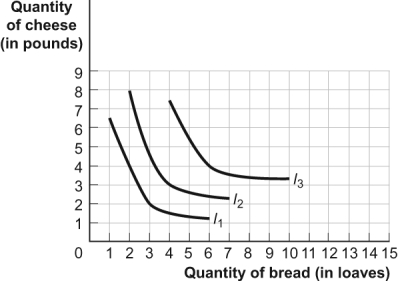
-(Figure: Harold's Indifference Curves) Look at the figure Harold's Indifference Curves. If the price of bread is $0.50 per loaf, the price of cheese is $1 per pound, and Harold has $7 to spend on bread and cheese, Harold's optimal consumption bundle is _____ loaves of bread and _____ pounds of cheese.
A) 6; 4
B) 4; 3
C) 3; 2
D) 2; 8
Correct Answer:
Verified
Q32: In terms of indifference curves,a demand curve
Q34: A _ can be generated from indifference
Q269: Use the following to answer questions:
Figure: Indifference
Q270: Use the following to answer questions:
Figure: Harold's
Q272: Use the following to answer questions:
Figure: The
Q273: Use the following to answer questions:
Figure: Harold's
Q276: Use the following to answer questions:
Figure: Indifference
Q277: Use the following to answer questions:
Figure: The
Q278: Use the following to answer questions:
Figure: Harold's
Q279: Use the following to answer questions:
Figure: Harold's
Unlock this Answer For Free Now!
View this answer and more for free by performing one of the following actions

Scan the QR code to install the App and get 2 free unlocks

Unlock quizzes for free by uploading documents