
Use the graph to answer the following question.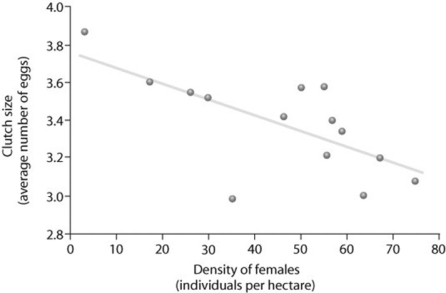
Based on the figure, which of the following statements correctly interprets the data?
A) Clutch size is always lowest at a density of about 35 females.
B) As female density increases, survivorship decreases.
C) Clutch size increases as female density increases.
D) Clutch size is inversely related to density.
Correct Answer:
Verified
Q25: Which statements about K are correct?
I. K
Q32: Use the graph to answer the following
Q33: During exponential growth, a population always _.
A)
Q33: Use the graph to answer the following
Q34: Which of the following graphs illustrates the
Q35: Which of the following graphs best illustrates
Q38: Use the graph to answer the following
Q39: Use the graph to answer the following
Q41: Use the figures to answer the following
Q48: A recent study of ecological footprints concluded
Unlock this Answer For Free Now!
View this answer and more for free by performing one of the following actions

Scan the QR code to install the App and get 2 free unlocks

Unlock quizzes for free by uploading documents