
Use the following figure to answer the question.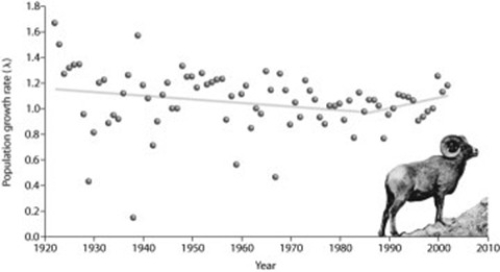
According to the figure, what is the most accurate explanation for the data after 1985?
A) emigration
B) immigration
C) introduction of new alleles into the population
D) increased resources in the area
Correct Answer:
Verified
Q32: If the sex ratio in a population
Q32: Which of the following strategies would most
Q33: The main purpose of movement corridors is
Q34: Which of the following nations has become
Q35: Use the following figure to answer the
Q35: Easter Island is an extremely isolated island
Q36: Use the following figure to answer the
Q40: Which of the following statements is accurate
Q55: The main cause of the increase in
Q57: The main goal of sustainable development is
Unlock this Answer For Free Now!
View this answer and more for free by performing one of the following actions

Scan the QR code to install the App and get 2 free unlocks

Unlock quizzes for free by uploading documents