Use the data given below to answer the following question(s).
Following is the purchase order database of 'The Chef Says So', a restaurant in New York, over the last quarter (April-June).
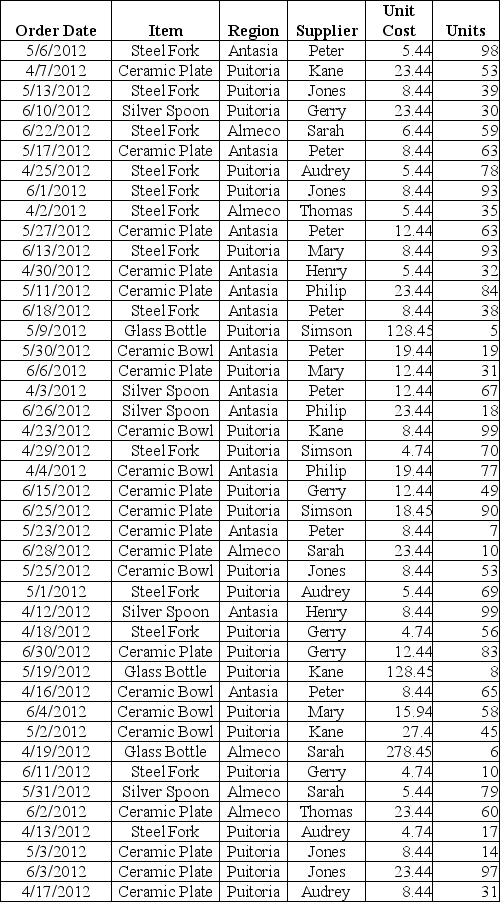
-Describe and construct a cross-tabulation showing the region-wise percentage breakdown of purchase of glass bottles and silver spoons and visually represent the data in a 3-D cylindrical chart.
Counts:
Percentages by Region:
Correct Answer:
Verified
View Answer
Unlock this answer now
Get Access to more Verified Answers free of charge
Q5: Use the data given below to
Q17: Peige, a stock broker, has data consisting
Q23: Use the data given below to
Q24: Construct a PivotChart to visualize the purchase
Q30: Use the data given below to
Q31: Use the data given below to
Q34: Use the data given below to
Q35: Use the data given below to
Q36: Use the data given below to
Q40: Use the data given below to
Unlock this Answer For Free Now!
View this answer and more for free by performing one of the following actions

Scan the QR code to install the App and get 2 free unlocks

Unlock quizzes for free by uploading documents