The diagram below shows how a rise in government expenditure (G) shifts the IS curve from IS1 to IS2. What are the levels of investments in Y1 and Y2 for a fixed r? 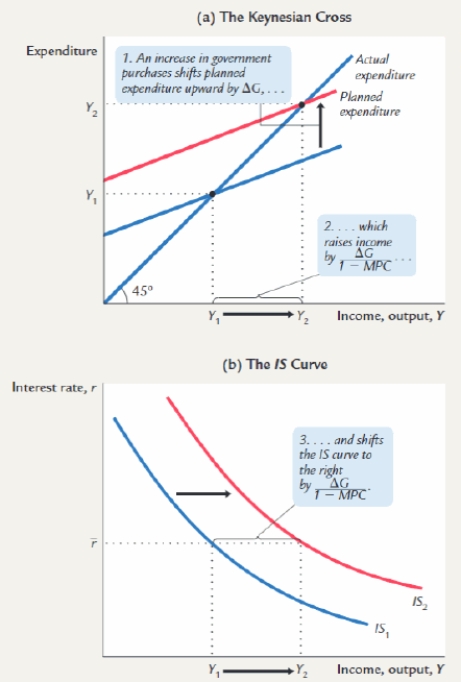
Correct Answer:
Verified
View Answer
Unlock this answer now
Get Access to more Verified Answers free of charge
Q70: Using the Keynesian-cross analysis, assume that the
Q71: In the money market, an increase in
Q72: In the Keynesian-cross analysis, if the consumption
Q73: The IS-LM model is generally used:
A)only in
Q74: Assume that the consumption function is given
Q78: Assume that money demand is given by
Q80: According to the Keynesian-cross analysis, if the
Q81: The IS and LM curves together generally
Q91: In the Keynesian-cross analysis, assume that the
Q99: Equilibrium levels of income and interest rates
Unlock this Answer For Free Now!
View this answer and more for free by performing one of the following actions

Scan the QR code to install the App and get 2 free unlocks

Unlock quizzes for free by uploading documents