Figure 25.2, The Baby Boom, 1946-1964, shows which of the following very clearly? 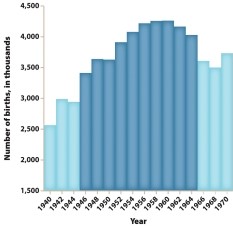
A) Americans used contraceptives beginning in 1940.
B) Birthrates changed most dramatically between 1944 and 1946 and between 1964 and 1966.
C) The average marriage age declined after 1960.
D) Fewer couples divorced between 1946 and 1964 than before or after.
Correct Answer:
Verified
Q44: The Little Rock Nine were known for
A)
Q45: President Eisenhower broke away from traditional Republican
Q46: Both the Brown decision and rock-and-roll were
Q47: A key factor leading to John F.
Q48: The first victories in the effort to
Q50: In this photo, taken during the Montgomery
Q51: Figure 25.1, Economic Growth, 1945-1965, makes which
Q52: Map 25.1, Lunch Counter Sit-Ins, February-April 1960,
Q53: Eisenhower's style of Republicanism was called "modern"
Q54: The Brown decision sparked the
A) activist career
Unlock this Answer For Free Now!
View this answer and more for free by performing one of the following actions

Scan the QR code to install the App and get 2 free unlocks

Unlock quizzes for free by uploading documents