Use the graphical approach to CVP analysis to solve the following problem.
A small manufacturing operation can produce up to 250 units per week of a product that it sells for $20 per unit. The variable cost per unit is $12, and the fixed costs per week are $1200.
a) How many units must the firm sell per week to break even?
b) Determine the firm's weekly profit or loss if it sells:
(i) 120 units per week (ii) 250 units per week
c) At what level of sales will the net income be $400 per week?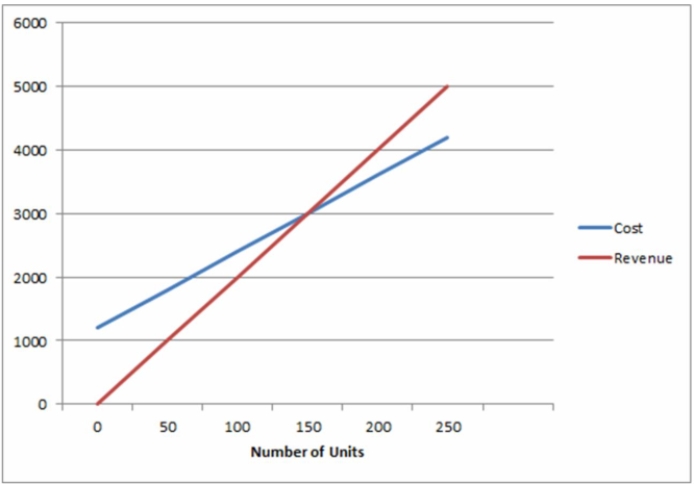
Correct Answer:
Verified
b) i) ...
View Answer
Unlock this answer now
Get Access to more Verified Answers free of charge
Q77: Once a business is operating beyond the
Q77: Once a business is operating beyond the
Q78: Dynacan Ltd. manufactured 10,000 units of product
Q79: A new product is expected to sell
Q80: Triax Corp. produced 50,000 gizmos at a
Q81: Enrique is studying the feasibility of producing
Q83: A small business calculates that its monthly
Q84: Sam manufactures a product that is selling
Q85: A company expects to sell 30,000 hats
Q87: A company makes gadgets selling for $15
Unlock this Answer For Free Now!
View this answer and more for free by performing one of the following actions

Scan the QR code to install the App and get 2 free unlocks

Unlock quizzes for free by uploading documents