 Figure 11-3a
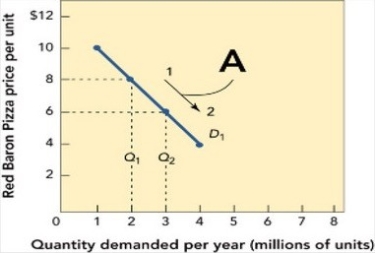
-Figure 11-3a shows shows that when the quantity demanded for Red Baron frozen cheese pizzas moves from 2 to 3 million units along the demand curve D1, the profit
A) increases from $6 to $8 per unit.
B) decreases from $8 to $6 per unit.
C) stays the same per unit.
D) increases from $2 to $3 per unit.
E) impacts cannot be determined. Figure 11-3a does not indicate what happens to profit when the quantity demanded changes.
Correct Answer:
Verified
Q126: The horizontal axis of a demand curve
Q131: Basic to setting a product's price is
Q141: Which of the following statements about the
Q154: The maximum quantity of products consumers will
Q162: All of the following are demand factors
Unlock this Answer For Free Now!
View this answer and more for free by performing one of the following actions

Scan the QR code to install the App and get 2 free unlocks

Unlock quizzes for free by uploading documents