Figure 4-12
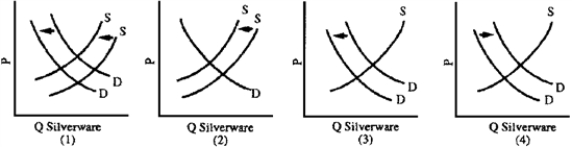
-The silverware industry has been in serious decline since the 1980s.Family dining habits are less formal so people purchase less silverware.Also, in 2006-2008, the price of silver increased from $5 to $20 per ounce.Which graph in Figure 4-12 best illustrates these developments?
A) 1
B) 2
C) 3
D) 4
Correct Answer:
Verified
Q209: Figure 4-16 Q210: Figure 4-16 Q212: Figure 4-15 Q213: Figure 4-11 Q215: The cost of processors and memory has Q216: Figure 4-16 Q217: Figure 4-13 Q218: Studies at Cornell University revealed that chickens Q219: Figure 4-16 Q222: If both the supply and demand curves Unlock this Answer For Free Now! View this answer and more for free by performing one of the following actions Scan the QR code to install the App and get 2 free unlocks Unlock quizzes for free by uploading documents
![]()
![]()
![]()
![]()
![]()
![]()
![]()

