Figure 6-8
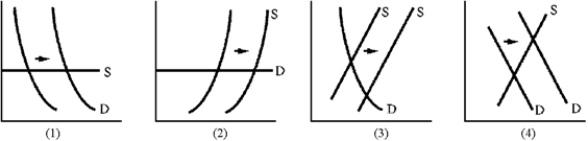
-Libya sold more crude oil in 1985 than it sold five years earlier, but revenues were 17 percent less.Which graph in Figure 6-8 is consistent with this set of facts?
A) 1
B) 2
C) 3
D) 4
Correct Answer:
Verified
Q134: The demand for Exxon gasoline is _
Q146: Regarding demand elasticity, which of the following
Q162: The demand for potatoes at current prices
Q163: If, as price increases by 10 percent,
Q168: If demand is unit elastic, revenue
A)and price
Q172: When the price of penicillin tablets increases
Q174: To avoid an increase in the local
Q174: Would a profit-maximizing firm sell where demand
Q175: If the marginal cost of producing vanity
Q179: Figure 6-7 ![]()
Unlock this Answer For Free Now!
View this answer and more for free by performing one of the following actions

Scan the QR code to install the App and get 2 free unlocks

Unlock quizzes for free by uploading documents