Figure 8-2
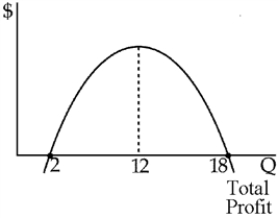
-Figure 8-2 shows a manufacturer's total profit curve.To maximize her total profit, the manufacturer should produce ____ units of output.
A) 10
B) 12
C) 16
D) 18
Correct Answer:
Verified
Q135: Average cost
A)is always larger than marginal cost.
B)declines
Q143: The typical total profit graphical presentation is
Q144: Figure 8-5 Q149: Marginal profit is the addition to a Q152: Total profit is maximized Q159: The demand curve facing Company ABC is Q164: Total profit is maximized if the slope Q165: If fixed cost rises, Q172: A profit-maximizing firm always Q180: If at optimum output of 1,000 units,![]()
A)where the difference between
A)the profit-maximizing level of
A)sells its output at
Unlock this Answer For Free Now!
View this answer and more for free by performing one of the following actions

Scan the QR code to install the App and get 2 free unlocks

Unlock quizzes for free by uploading documents