Figure 12-2
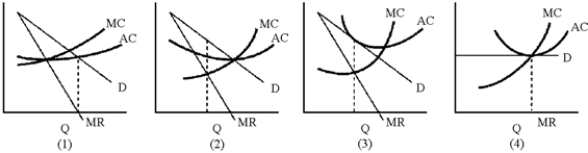
-In Figure 12-2, which of the graphs represents a firm that is a sales revenue maximizer?
A) 1
B) 2
C) 3
D) 4
Correct Answer:
Verified
Q108: Monopolistic competition in long-run equilibrium is characterized
Q110: A profit-maximizing, monopolistically competitive restaurant serves 60
Q124: An oligopoly is a market
A)with few buyers.
B)with
Q125: A monopolistically competitive firm in the long
Q126: What is the long-run effect on the
Q129: The excess capacity theorem implies that
A)consumers would
Q136: A firm in a monopolistically competitive market
Q146: Oligopolists
A)are price takers.
B)rarely advertise.
C)must take rivals' reactions
Q150: The market structure that is associated with
Q152: Heavy advertising expenditures usually indicate
A)oligopoly.
B)pure competition or
Unlock this Answer For Free Now!
View this answer and more for free by performing one of the following actions

Scan the QR code to install the App and get 2 free unlocks

Unlock quizzes for free by uploading documents