Figure 12-3
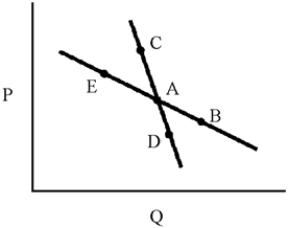
-In Figure 12-3, demand curve CAD represents a market in which oligopolists will match the price changes of rivals and demand curve EAB represents a market in which oligopolists will ignore the price changes of rivals.According to the kinked demand model, the relevant demand curve will be
A) demand curve CAB.
B) demand curve CAD.
C) demand curve EAD.
D) demand curve EAB.
Correct Answer:
Verified
Q175: Displayed below is the payoff matrix of
Q177: There is statistical evidence that managers' salaries
Q180: Figure 12-3 Q181: Displayed below is the payoff matrix of Q183: In a perfectly contestable market in the Q186: A duopoly is Q193: Game theory applies to problems that arise
![]()
A)a cartel in which all
Unlock this Answer For Free Now!
View this answer and more for free by performing one of the following actions

Scan the QR code to install the App and get 2 free unlocks

Unlock quizzes for free by uploading documents