Figure 14-2
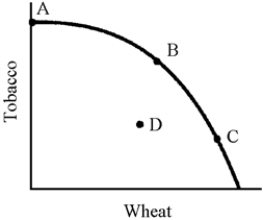
-As we move down the production possibilities schedule in Figure 14-2, each successive point is
A) less efficient.
B) more efficient.
C) equally efficient.
D) more or less efficient; we cannot tell which.
Correct Answer:
Verified
Q61: Figure 14-1 Q66: Uncoordinated decisions in perfect competition lead to Q66: Figure 14-2 Q67: What does the production possibility curve imply Q68: "Fair" outcomes and "efficient" outcomes are always Q70: Market systems can be evaluated as efficient Q76: For any combination or outputs, there is Q86: The existence of a universal law of Q89: Centrally planned economies do not use the Q98: The distribution process performed by the price
![]()
![]()
Unlock this Answer For Free Now!
View this answer and more for free by performing one of the following actions

Scan the QR code to install the App and get 2 free unlocks

Unlock quizzes for free by uploading documents