Figure 19-1
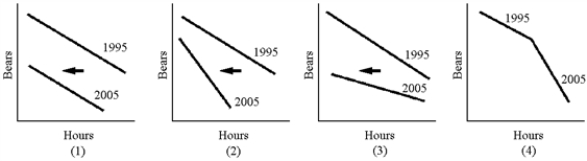
-Mr.Paque is a bear hunter for timber companies that want to diminish damage to trees done by bears in the spring.Due to a reduction in the bear population between 1995 and 2005, Mr.Paque finds fewer bears each year and additional hours spent hunting produce fewer additional bears.The change in Mr.Paque's MPP curve between 1995 and 2005 is best illustrated by which panel in Figure 19-1?
A) 1
B) 2
C) 3
D) 4
Correct Answer:
Verified
Q81: The demand curve for a factor is
Q82: Mr.Paque is a bear hunter for timber
Q83: Figure 19-2 Q86: Marginal physical product is Q87: If the demand for softballs increases, one Q88: Mr.Calhoun owned a worn-out piece of farmland Q90: The principle of marginal productivity Q94: A recent decline in interest rates made Q95: According to the principle of marginal productivity, Q96: Which of the following best describes the![]()
A)the increase in input
A)is the same
Unlock this Answer For Free Now!
View this answer and more for free by performing one of the following actions

Scan the QR code to install the App and get 2 free unlocks

Unlock quizzes for free by uploading documents