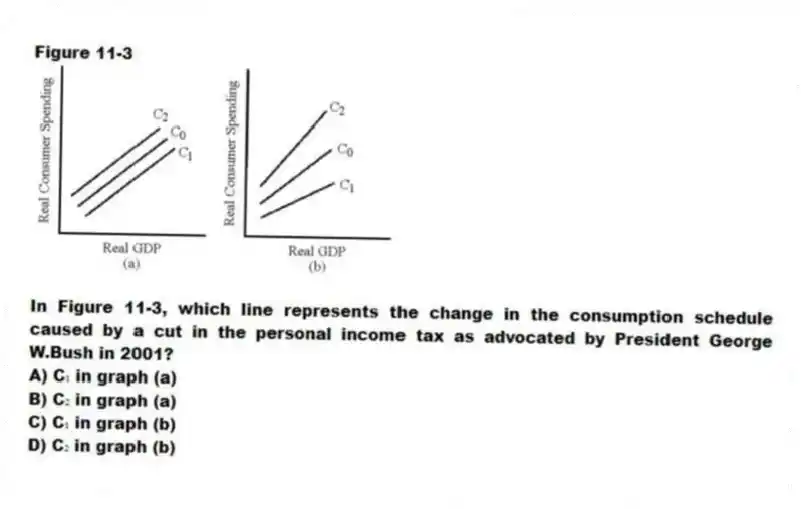
Figure 11-3
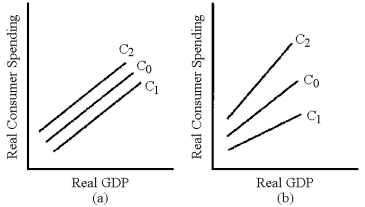
-In Figure 11-3, which line represents the change in the consumption schedule caused by a cut in the personal income tax as advocated by President George W.Bush in 2001?
A) C₁ in graph (a)
B) C₂ in graph (a)
C) C₁ in graph (b)
D) C₂ in graph (b)
Correct Answer:
Verified
Q182: As a general rule, when an income
Q185: Table 11-1 Q187: Table 11-1 Q188: Why does the numerical value of the Q197: A Keynesian economist would expect a supply-side Q198: Define the following terms and explain their Q201: How do transfer payments function as negative Q202: What is the difference between tax cuts Q205: Explain some of the steps that a Q207: What are the policies usually advocated by![]()
![]()
Unlock this Answer For Free Now!
View this answer and more for free by performing one of the following actions

Scan the QR code to install the App and get 2 free unlocks

Unlock quizzes for free by uploading documents