Multiple Choice
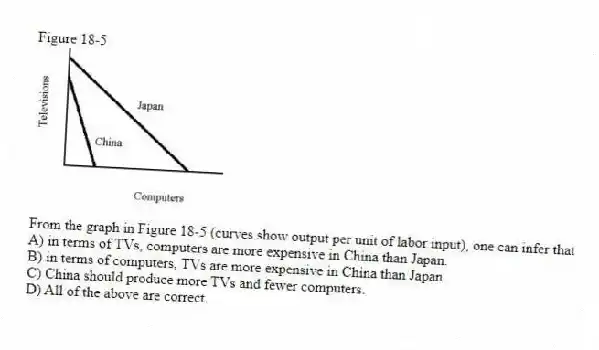
Figure 18-5
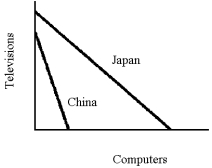
-From the graph in Figure 18-5 (curves show output per unit of labor input) , one can infer that
A) in terms of TVs, computers are more expensive in China than Japan.
B) in terms of computers, TVs are more expensive in China than Japan.
C) China should produce more TVs and fewer computers.
D) All of the above are correct.
Correct Answer:
Verified
Related Questions
Q101: If two countries each are currently producing
Q105: Suppose that Captain Canada can produce 100
Q111: Figure 18-3 Q113: Figure 18-2 Q114: A country can gain by importing a
![]()
![]()

