Multiple Choice

Figure 18-6
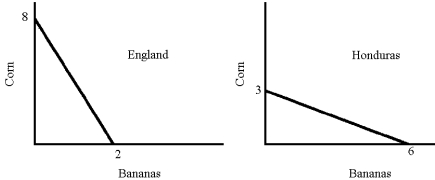
-From the graph in Figure 18-6, the opportunity cost of a unit of bananas is
A) 4 units of corn for England; 1/2 unit of corn for Honduras.
B) 1/4 unit of corn for England; 2 units of bananas in England.
C) 8 units of corn in England; 3 units of corn in Honduras.
D) 4 units of corn in England; 12 units of corn in Honduras.
Correct Answer:
Verified
Related Questions

