(Figure: Price and Quantity I) The graph shows a firm's marginal cost curve. This firm operates in a perfectly competitive industry with market demand and supply curves given by Qd = 100 - 8P and QS = -20 + 2P, where Q is measured in millions of units. Based on the figure, how many units of output will the firm produce at the equilibrium price? 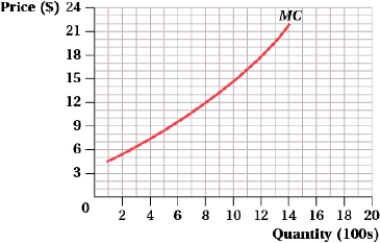
A) 1,100
B) 800
C) 1,200
D) 400
Correct Answer:
Verified
Q31: (Figure: Firm I) At the profit maximizing
Q32: Suppose that the market for ice cream
Q33: In the market for lock washers, a
Q34: Suppose that a firm is producing where
Q35: Suppose that each firm in a perfectly
Q37: Suppose that the long-run total cost curve
Q38: Suppose that a firm is producing where
Q39: If the long-run total cost curve for
Q40: Suppose the market for sprouts is in
Q41: In the lemonade stand industry, Lucia is
Unlock this Answer For Free Now!
View this answer and more for free by performing one of the following actions

Scan the QR code to install the App and get 2 free unlocks

Unlock quizzes for free by uploading documents