(Figure: Price and Quantity XI) Which of the following statements is (are) TRUE? 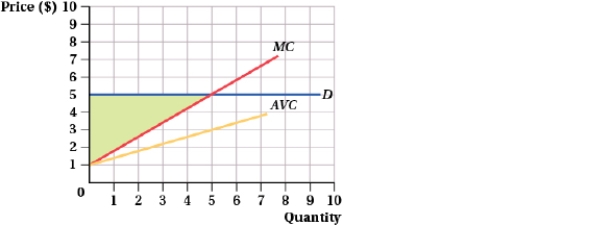 I. Producer surplus = TR - VC = $25 - $15.
II) The shaded area between the demand curve and marginal cost represents producer surplus and equals $10.
III) The firm's profit = $10 - FC.
A) I, II, and III
B) II
C) I and III
D) III
Correct Answer:
Verified
Q75: (Figure: Profit-Maximizing Output Level I) At the
Q76: (Figure: Long Run Output I) Initially, the
Q77: In a perfectly competitive market with 2,000
Q78: Suppose that the market for gourmet deli
Q79: Use the following table to answer the
Q81: Suppose that a firm is producing where
Q82: (Figure: Firm I) This firm's profit maximizing
Q83: (Figure: Price and Quantity V) At the
Q84: (Table: Firms A and B I)
Q85: To maximize profits, a firm should produce
Unlock this Answer For Free Now!
View this answer and more for free by performing one of the following actions

Scan the QR code to install the App and get 2 free unlocks

Unlock quizzes for free by uploading documents