(Figure: Cost and Quantity of Output IV) Using the information provided in Figure 7.18, graph the firm's MC, ATC, and AVC curves in one diagram. 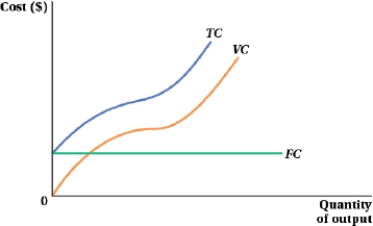
Indicate the minimum points on the AVC and ATC curves. In a separate diagram, show the firm's AFC curve.
Correct Answer:
Verified
View Answer
Unlock this answer now
Get Access to more Verified Answers free of charge
Q165: A firm has a production function of
Q166: Jasmine started a lawn-fertilizing business and is
Q167: Complete the following table. Q168: A firm has a production function of Q169: A firm's long-run total cost function is Q171: Meera operates Ducks Unlimited, which raises mallard Q172: Consider the table. What important characteristic describes Q173: SeakayakingUK is a small business that makes Q174: Answer the following questions. Q175: Suppose a firm's total cost curve is![]()
a. If TC =
Unlock this Answer For Free Now!
View this answer and more for free by performing one of the following actions

Scan the QR code to install the App and get 2 free unlocks

Unlock quizzes for free by uploading documents