(Figure: Good Y and Good X III) The price of good Y _____, increasing the consumption of both good Y and good X, which are _____. 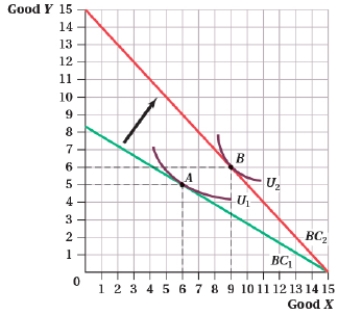
A) increased; complements
B) decreased; substitutes
C) increased; substitutes
D) decreased; complements
Correct Answer:
Verified
Q9: (Figure: Hourly Wage and Hours of Labor
Q10: Which of the following statements about Marshallian
Q11: In 2010, the average household spent $1,178
Q12: (Figure: Good Y and Good X V)
Q13: (Figure: Market for DS Video Games I)
Q15: To derive the Engel curve, which shows
Q16: (Figure: Dog Treats and Milk I) When
Q17: (Figure: Quantity of Goods Y and X
Q18: For the Cobb-Douglas utility function:
A) the income
Q19: For the special case of a Giffen
Unlock this Answer For Free Now!
View this answer and more for free by performing one of the following actions

Scan the QR code to install the App and get 2 free unlocks

Unlock quizzes for free by uploading documents