(Figure: Beef Jerky and Scallops I) 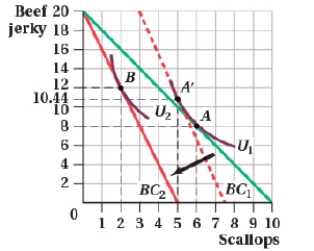 According to the figure, the income effect associated with the increase in the price of scallops is a movement from ____ to _____ scallops.
A) 6; 5
B) 6; 2
C) 5; 2
D) 5; 6
Correct Answer:
Verified
Q98: (Figure: Quantity of Goods Y and X
Q99: (Figure: Beef Jerky and Scallops I)
Q100: Amisha's Engel curve for potato chips is
Q101: A consumer's bundle includes good X and
Q102: Which of the following statements are TRUE?
I.
Q104: A consumer's bundle includes two normal goods,
Q105: Suppose that there are two goods, X
Q106: (Figure: Good Y and Good X X)
Q107: (Figure: Quantity of Goods Y and X
Q108: (Figure: Good Y and Good X VI)
Unlock this Answer For Free Now!
View this answer and more for free by performing one of the following actions

Scan the QR code to install the App and get 2 free unlocks

Unlock quizzes for free by uploading documents