(Figure: Price and Quantity of Skirts I) This graph shows the demand curve for skirts. Suppose the consumer has $500 to spend on skirts and handbags, and the price of handbags remains unchanged at $100. Using budget constraints and indifference curves, placing skirts on the horizontal axis and handbags on the vertical axis, illustrate two of the consumer's optimal consumption bundles of skirts and handbags. 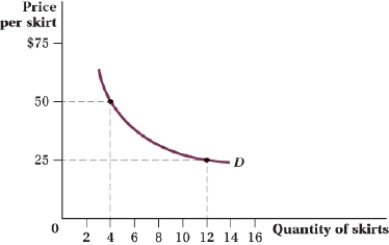
Correct Answer:
Verified
Q106: (Figure: Good Y and Good X X)
Q107: (Figure: Quantity of Goods Y and X
Q108: (Figure: Good Y and Good X VI)
Q109: Siti is one of many consumers in
Q110: Suppose there are 100 consumers in the
Q112: Suppose that there are two goods, X
Q113: Eidi has $100 to spend on video
Q114: (Figure: Quantity of Good Y and X
Q115: Which of the following statements about Hicksian
Q116: (Figure: VI) The price of good Y
Unlock this Answer For Free Now!
View this answer and more for free by performing one of the following actions

Scan the QR code to install the App and get 2 free unlocks

Unlock quizzes for free by uploading documents