(Figure: Price and Quantity VII) The area that represents producer surplus with the demand curve D1 is _____, and the area that represents producer surplus with the demand curve D2 is ____. 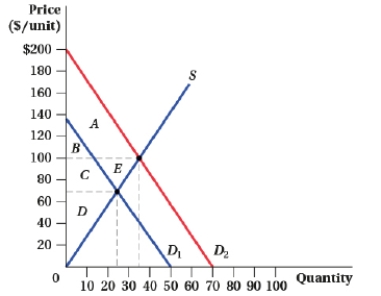
A) D; C + D + E
B) D; D + C
C) C + D + E; D
D) B + C; A + B
Correct Answer:
Verified
Q63: The supply and demand for solar panels
Q64: (Figure: Market for Peanuts I) Suppose the
Q65: Suppose that a local government has imposed
Q66: The supply and demand for solar panels
Q67: (Figure: Market for Tickets II) As a
Q69: (Figure: Market for Tickets II) Refer to
Q70: (Figure: Price and Quantity I) The decrease
Q71: Suppose the demand and supply curves for
Q72: Which of the following payroll taxes would
Q73: Suppose the demand and supply curves for
Unlock this Answer For Free Now!
View this answer and more for free by performing one of the following actions

Scan the QR code to install the App and get 2 free unlocks

Unlock quizzes for free by uploading documents