(Figure: Demand Shifts II) Using the figure, which factor could cause the demand curve to shift out from D1 to D2? 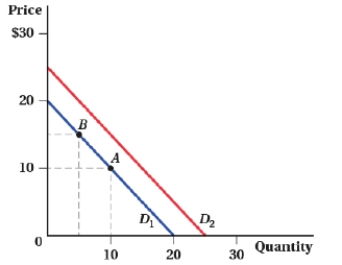
A) an increase in the price of a complement good
B) a decrease in the number of consumers
C) a decrease in the price of a complement good
D) an decrease in the price of the good
Correct Answer:
Verified
Q18: Suppose that the market demand curve for
Q19: The inverse supply equation for clay pots
Q20: If the price of crude oil increases
Q21: In the market for good X, demand
Q22: Which of the following statements is TRUE?
A)
Q24: The inverse supply equation for clay pots
Q25: In the standard model, we expect the
Q26: The supply curve of rubber balls is
Q27: If a 5% increase in income increases
Q28: (Figure: Markets and Goods) Assuming the good
Unlock this Answer For Free Now!
View this answer and more for free by performing one of the following actions

Scan the QR code to install the App and get 2 free unlocks

Unlock quizzes for free by uploading documents