(Figure: Public Goods) The graph shows the marginal benefit curves for two consumers of a public good. 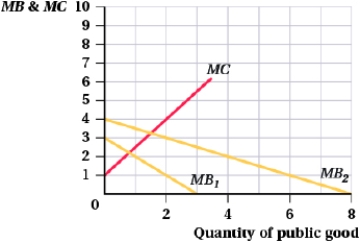
a. Graph the total marginal benefit curve.
b. What is the total marginal benefit of 4 units of a public good?
c. What is the efficient quantity of the public good?
Correct Answer:
Verified
View Answer
Unlock this answer now
Get Access to more Verified Answers free of charge
Q95: Hamid and Lee are neighbors. Hamid has
Q96: The production of toilet paper in a
Q97: (Table: Good Categories) Tick off the appropriate
Q98: Suppose the market for dry cleaning has
Q99: (Table: Benefits and Costs of Lawn Mowing)
Q101: (Table: Neighborhood Playground) The willingness to pay
Q102: Recreation centers offer a place for young
Q103: The marginal cost of pollution is MC
Q104: Assume the social marginal benefit of remote-control
Q105: (Figure: Externalities) Answer the following questions.
Unlock this Answer For Free Now!
View this answer and more for free by performing one of the following actions

Scan the QR code to install the App and get 2 free unlocks

Unlock quizzes for free by uploading documents