(Figure: Marginal Productivity of Apple Pickers I) Assume that the marginal productivity of apple pickers has increased. Which graph best illustrates this change? 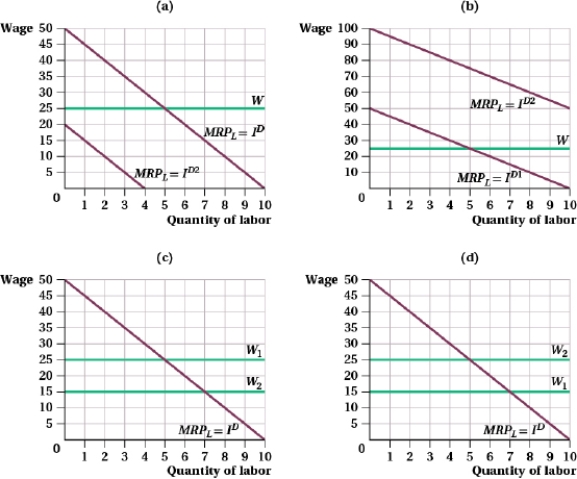
A) (a)
B) (b)
C) (c)
D) (d)
Correct Answer:
Verified
Q3: A union faces a labor demand curve
Q4: A monopsony has a marginal revenue product
Q5: A pizza shop's marginal product of labor,
Q6: Suppose the demand faced by a labor
Q7: (Figure: Labor Union Wages I) The figure
Q9: A pizza shop's marginal product of labor,
Q10: Which of the following statement(s) is (are)
Q11: (Figure: Budget Constraints and Indifference Curves I)
Q12: A monopsony has a marginal revenue product
Q13: (Figure: Budget Constraints and Indifference Curves I)
Unlock this Answer For Free Now!
View this answer and more for free by performing one of the following actions

Scan the QR code to install the App and get 2 free unlocks

Unlock quizzes for free by uploading documents