(Figure: Marginal Productivity of Apple Pickers I) There is a decrease in total factor productivity. Which graph best illustrates this change? 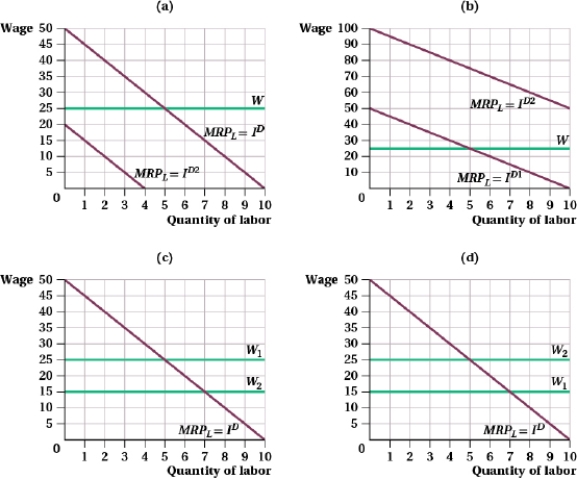
A) (a)
B) (b)
C) (c)
D) (d)
Correct Answer:
Verified
Q75: The marginal revenue product of labor is
Q76: Table (Baristas Labor I). Suppose that the
Q77: (Figure: Labor Union Wages I) The figure
Q78: Which of the following may affect a
Q79: Suppose the demand faced by a labor
Q81: On a graph, draw an indifference curve
Q82: Explain how a union is similar to
Q83: A pizza shop's marginal product of labor,
Q84: Explain how the following would affect the
Q85: A firm sells bagels for 50 cents
Unlock this Answer For Free Now!
View this answer and more for free by performing one of the following actions

Scan the QR code to install the App and get 2 free unlocks

Unlock quizzes for free by uploading documents