(Figure: Market for Two-Firm Industry II) The graph depicts the market demand curve for a two-firm industry with no fixed costs. 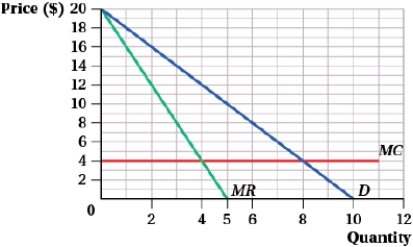 Suppose that the two firms are colluding by acting like a monopolist, with each firm producing half the market output. If one of the firms cheats on the cartel agreement and produces an additional unit of output, its profits will rise from:
A) $16 to $18.
B) $32 to $36.
C) $24 to $32.
D) $16 to $24.
Correct Answer:
Verified
Q80: Suppose that two firms are competing on
Q81: An industry faces the demand curve Q
Q82: A Nash equilibrium occurs when:
A) each firm
Q83: Consider a two-firm oligopoly facing a market
Q84: (Table: Airline Baggage Fees II) 
Q86: The inverse demand for shampoo is given
Q87: The inverse demand for designer blankets is
Q88: An industry faces the demand curve Q
Q89: Two companies are the only snowplow merchants
Q90: In Bertrand competition with identical goods, the
Unlock this Answer For Free Now!
View this answer and more for free by performing one of the following actions

Scan the QR code to install the App and get 2 free unlocks

Unlock quizzes for free by uploading documents