Multiple Choice
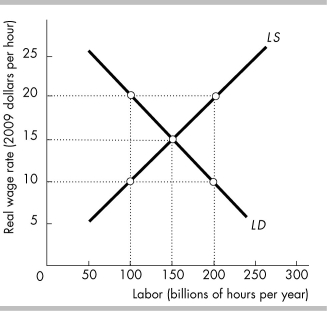
-In the above figure, the equilibrium level of labor is
A) 100 billion hours.
B) 150 billion hours.
C) 200 billion hours.
D) none of the above
Correct Answer:
Verified
Related Questions
-In the above figure, the equilibrium level of labor is
A) 100 billion hours.
B) 150 billion hours.
C) 200 billion hours.
D) none of the above
Correct Answer:
Verified

