
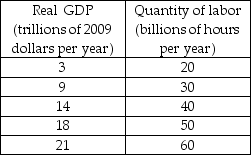
-The tables above show the labor market and the production function schedule for the country of Pickett. An increase in population changes the labor supply by 20 billion hours at each real wage rate. Potential GDP
A) does not change.
B) decreases to $3 trillion.
C) increases to $50 trillion.
D) increases to $18 trillion.
Correct Answer:
Verified
Q123: The real wage rate will fall if
Q124: If the population increases, then potential GDP
Q125: The U.S. employment-to-population ratio peaked in 2000
Q126: If the labor and capital grow more
Q127: An increase in the population and hence
Q129: The U.S. employment-to-population ratio peaked in 2000
Q130: Labor growth depends mainly on _ and
Q131: An increase in the working-age population results
Q132: Real GDP grows when
I. the quantities of
Q133: ![]()
Unlock this Answer For Free Now!
View this answer and more for free by performing one of the following actions

Scan the QR code to install the App and get 2 free unlocks

Unlock quizzes for free by uploading documents