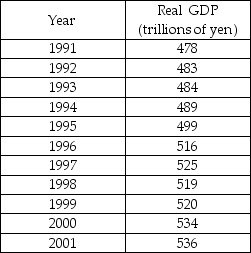
-The table above shows Japan's real GDP between 1991 to 2001.
a) Draw a figure with Japan's real GDP from 1991 to 2001.
b) In the previous 30 years, the growth rate of Japan's potential GDP was 6 percent a year. On your graph, show the path that potential GDP would have followed if its GDP in 1991 was equal to potential GDP and the growth rate of potential GDP had been maintained in 1991-2001.
c) Show the Lucas wedge on your figure.
Correct Answer:
Verified
b) Potential G...
View Answer
Unlock this answer now
Get Access to more Verified Answers free of charge
Q350: An expansion ends when the economy hits
Q351: The largest component of income is proprietors'
Q352: To measure economic welfare, one needs only
Unlock this Answer For Free Now!
View this answer and more for free by performing one of the following actions

Scan the QR code to install the App and get 2 free unlocks

Unlock quizzes for free by uploading documents