Multiple Choice
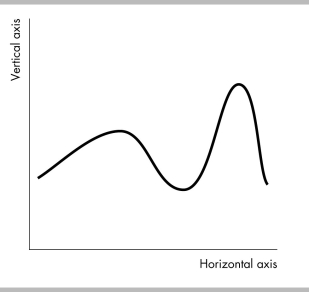
-The figure above shows a time-series graph. The horizontal axis measures ________ and the vertical axis measures ________.
A) time; x-values
B) time; the variable of interest
C) the variable of interest; time
D) y-values; the variable of interest
Correct Answer:
Verified
Related Questions
Q362: Which of the following is TRUE regarding
Q363: Q364: A time-series graph reveals whether there is Q365: Inflation climbed steadily from 1952 to 1972. Q366: Which of the following is CORRECT about Unlock this Answer For Free Now! View this answer and more for free by performing one of the following actions Scan the QR code to install the App and get 2 free unlocks Unlock quizzes for free by uploading documents![]()

