Multiple Choice
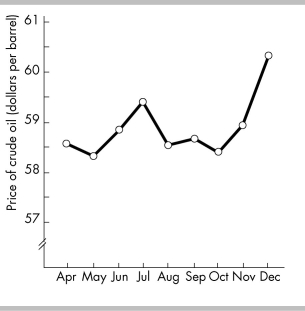
-Using the above figure, during which of the following periods does the price of crude oil shows an upward trend?
A) May to November
B) May to July and October to December
C) July to October
D) April to November
Correct Answer:
Verified
Related Questions
Q368: Q369: A trend is Q370: Q371: A trend shows Q372: The horizontal axis on a time-series graph Q374: A time-series graph showing total production in Q375: A time-series graph displays the price of Unlock this Answer For Free Now! View this answer and more for free by performing one of the following actions Scan the QR code to install the App and get 2 free unlocks Unlock quizzes for free by uploading documents![]()
A) a measure of closeness![]()
A) the degree of correlation
A)

