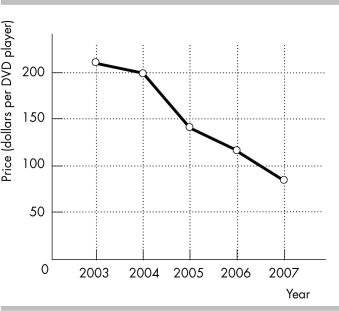
-The figure above shows the price of a DVD player from 2003 to 2007.
a) What type of graph is illustrated above?
b) What is the trend in the price of a DVD player?
Correct Answer:
Verified
View Answer
Unlock this answer now
Get Access to more Verified Answers free of charge
Q383: The chain-weighted output index method
A) is used
Q384: A graph shows the wages of factory
Q385: A trend is a general tendency for
Q386: The chain-weighted output index
A) uses only the
Q387: A time series graph can show both
Q389: The chain-weighted output index method of calculating
Q390: On a time-series graph with a ratio
Q391: Which of the following is TRUE regarding
Q392: At 2017 prices, the value of production
Q393: What kind of information is conveyed in
Unlock this Answer For Free Now!
View this answer and more for free by performing one of the following actions

Scan the QR code to install the App and get 2 free unlocks

Unlock quizzes for free by uploading documents