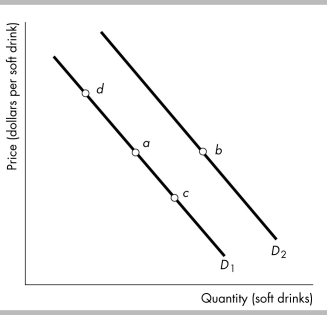
-Consider the demand curves for soft drinks shown in the figure above. A movement from point a to point b represents
A) a decrease in quantity demanded.
B) an increase in demand.
C) an increase in quantity demanded.
D) a decrease in demand.
Correct Answer:
Verified
Q152: The quantity supplied of a good is
A)
Q153: Which of the following is NOT held
Q154: Which of the following explains why supply
Q155: The supply curve slopes upward when graphed
Q156: The "law of supply" states that, other
Q158: The quantity supplied of a good or
Q159: A recession occurs and people's incomes decrease.
Q160: A fall in the price of a
Q161: An increase in the number of fast-food
Q162: Auto workers negotiate a wage increase. How
Unlock this Answer For Free Now!
View this answer and more for free by performing one of the following actions

Scan the QR code to install the App and get 2 free unlocks

Unlock quizzes for free by uploading documents