Multiple Choice
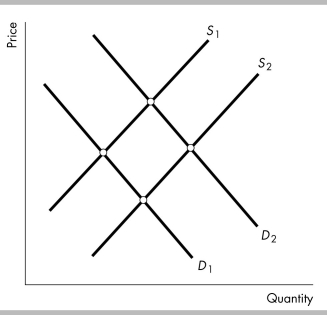
-The above figure shows the market for gasoline. When a hurricane destroys a major refinery that refines oil into gasoline, the
A) demand curve for gasoline shifts from D1 to D2 and the supply curve of gasoline does not shift.
B) demand curve for gasoline shifts from D1 to D2 and the supply curve of gasoline shifts from S2 to S1.
C) demand curve for gasoline does not shift, and the supply curve of gasoline shifts from S2 to S1.
D) demand curve for gasoline does not shift, and the supply curve of gasoline shifts from S1 to S2.
Correct Answer:
Verified
Related Questions

