Multiple Choice
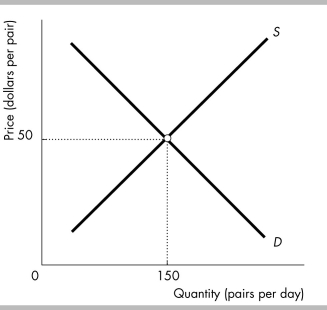
-The figure illustrates the demand for and supply for jeans. Suppose jeans are a normal good and people's incomes increase. At the initial price of $50 for a pair of jeans, after the increase in income the quantity demanded is ________ than the equilibrium quantity and there is a ________ of jeans.
A) greater; surplus
B) greater; shortage
C) less; surplus
D) less; shortage
Correct Answer:
Verified
Related Questions

