Multiple Choice
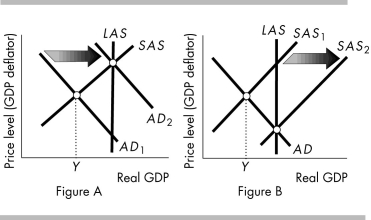
-Which aggregate supply-aggregate demand diagram above shows the effect on real GDP and the price level of monetary policy when it is used to fight a recession?
A) only Figure A
B) only Figure B
C) both Figure A and Figure B
D) neither Figure A nor Figure B
Correct Answer:
Verified
Related Questions
Q140: Suppose that several European countries enter a
Q141: The Taylor Rule states that the
A) Fed
Q142: Suppose that the equilibrium real interest rate
Unlock this Answer For Free Now!
View this answer and more for free by performing one of the following actions

Scan the QR code to install the App and get 2 free unlocks

Unlock quizzes for free by uploading documents