Multiple Choice
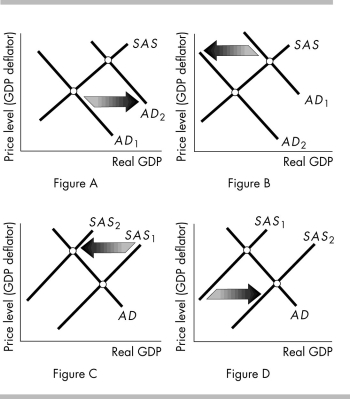
-In the above, which figure shows the start of a cost-push inflation?
A) Figure A
B) Figure B
C) Figure C
D) Figure D
Correct Answer:
Verified
Related Questions
Q170: Q171: As far as demand-pull inflation goes, the Q172: To stop a demand-pull inflation using monetary Q173: Cost-push inflation can be started by Q174: Cost-push inflation can start with Q176: Cost-push inflation can start with Q177: A demand-pull inflation occurred in the United Q178: In April 2008 the price of oil![]()
A) a
A) lower taxes.
B)
A) a decrease
Unlock this Answer For Free Now!
View this answer and more for free by performing one of the following actions

Scan the QR code to install the App and get 2 free unlocks

Unlock quizzes for free by uploading documents