Multiple Choice
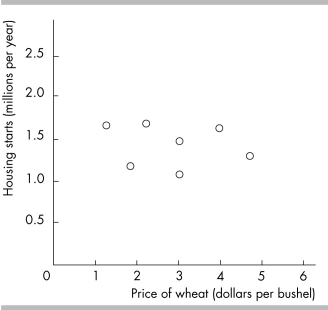
-The above figure graphs the price of a bushel of wheat and housing starts. The graph shows the variables are
A) strongly positively related.
B) strongly negatively related.
C) not related.
D) related via an indirect relationship.
Correct Answer:
Verified
Related Questions

