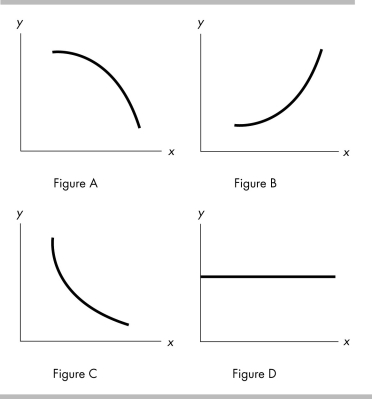
-In the above figure, which of the graphs demonstrates a curve with a decreasing slope, that is, a slope getting smaller in magnitude as x increases?
A) Figure A
B) Figure B
C) Figure C
D) Figure D
Correct Answer:
Verified
Q299: Suppose you produce 10 bikes a day
Q300: The variable measured on the y-axis increases
Q301: As the number of days without rain
Q302: If there is an inverse relationship between
Q303: "As the price of gasoline increases, fewer
Q305: Along a curve, when one variable increases,
Q306: Suppose that we find that student grades
Q307: As a firm produces more and more
Q308: Q309: ![]()
![]()
Unlock this Answer For Free Now!
View this answer and more for free by performing one of the following actions

Scan the QR code to install the App and get 2 free unlocks

Unlock quizzes for free by uploading documents