Multiple Choice
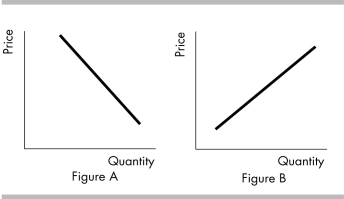
-In the above figure, a negative relationship between price and quantity is shown in
A) Figure A.
B) Figure B.
C) both Figure A and Figure B.
D) neither Figure A nor Figure B.
Correct Answer:
Verified
Related Questions
Q332: The graph of two variables, x and
Q333: A graph shows the price of a
Q334: If two variables are unrelated, a scatter
Q335: As a firm expands its output, cost
Q336: If a curve falls and then rises,
Q338: Q339: When y changes, x stays the same. Q340: A graph measures y on the vertical Q341: Q342: Unlock this Answer For Free Now! View this answer and more for free by performing one of the following actions Scan the QR code to install the App and get 2 free unlocks Unlock quizzes for free by uploading documents![]()
![]()
![]()

