Multiple Choice
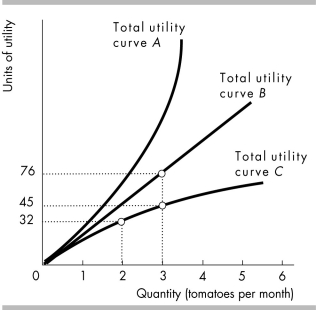
-In the figure above, the curve that shows the diminishing marginal utility is
A) total utility curve A because it gets steeper as consumption of tomatoes increases.
B) total utility curve A because it is higher than total utility curves B or C.
C) total utility curve C because it gets flatter as consumption of tomatoes increases.
D) total utility curve C because it is lower than total utility curves B and C.
Correct Answer:
Verified
Related Questions
Q44: If marginal utility is positive but diminishing,
Q45: As the quantity of a good consumed
Q46: If marginal utility is positive but diminishing,
Q47: As consumption increases, total utility increases
A) at

