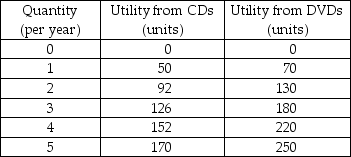
-Margo buys music CDs and movies on DVDs. The table above shows her total utility from each good.
a) Draw graphs showing Margo's utility from music CDs and from movies on DVDs.
b) Compare the two utility graphs. Describe Margo's preferences.
c) Draw graphs that show Margo's marginal utility from music CDs and from movies on DVDs.
d) What do the two marginal utility graphs tell you about Margo's preferences?
Correct Answer:
Verified
View Answer
Unlock this answer now
Get Access to more Verified Answers free of charge
Q356: Marginal utility diminishes as consumption of a
Q357: As a person consumes more and more
Q358: When Kathryn spends her entire budget and
Q359: If it costs $6.00 to go to
Q360: If it costs $12.00 to go to
Q361: If the price of a good increases,
Q362: Tom's marginal utility of Mountain Dew exceeds
Q363: When Tom's income increases, his demand curve
Q365: The Paradox of Value is resolved by
Q366: ![]()
Unlock this Answer For Free Now!
View this answer and more for free by performing one of the following actions

Scan the QR code to install the App and get 2 free unlocks

Unlock quizzes for free by uploading documents