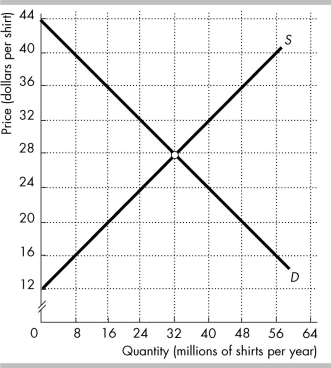
 The figure shows the market for shirts in the United States, where D is the domestic demand curve and S is the domestic supply curve. The world price is $20 per shirt.
-In the figure above, international trade ________ consumer surplus in the United States by ________.
A) increases; $320 million
B) decreases; $192 million
C) increases; $192 million
D) decreases; $320 million
Correct Answer:
Verified
Q8: In a market open to international trade,
Q19: The goods and services that our country
Q20: Compared to the situation before international trade,
Unlock this Answer For Free Now!
View this answer and more for free by performing one of the following actions

Scan the QR code to install the App and get 2 free unlocks

Unlock quizzes for free by uploading documents